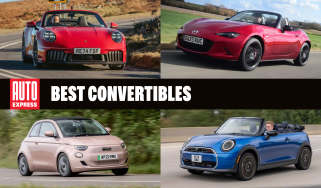
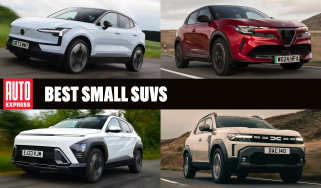
The best cars to buy now
What are the best cars you can buy? We have all the answers...
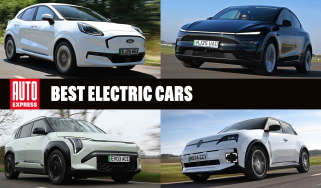
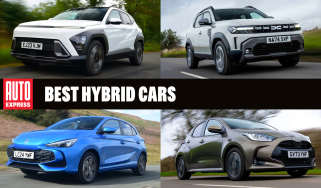
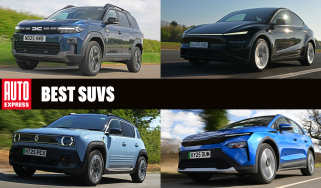
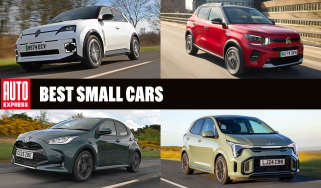
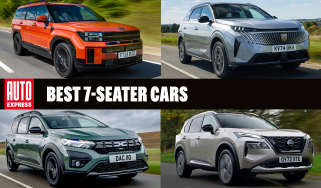
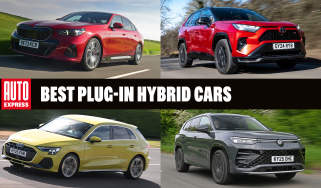
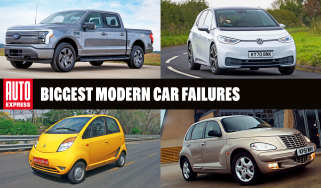
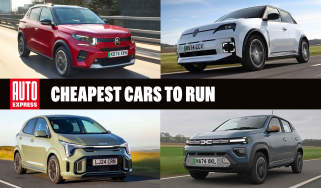
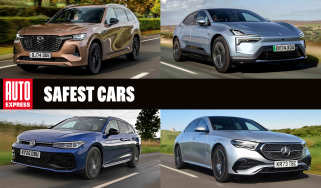
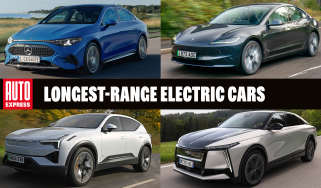
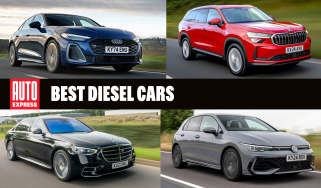
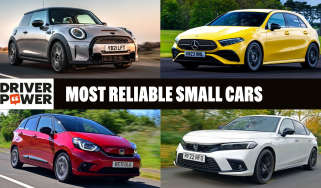
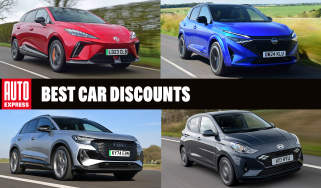
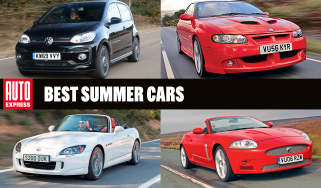
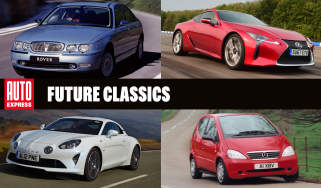
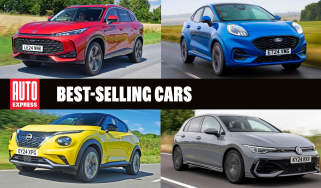
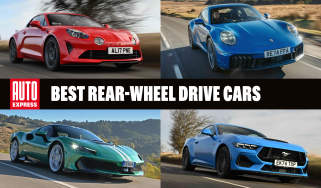
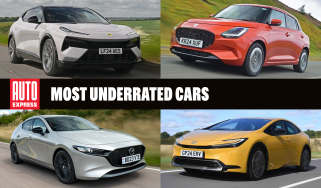
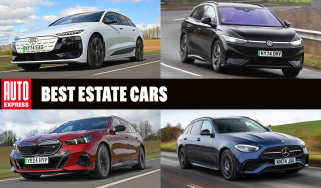
If you’re looking to take the first steps on the road to a new car, you’ve come to the right place. Our ‘best cars’ pages are the perfect way to build your new car buying shortlist, finding out which are the best cars in every category and class across the UK car market.
Our experienced road testers have driven and extensively tested every new car on sale in the UK and their expert verdicts are used to rank the cars in the top 10 lists you’ll find below. Take a look at the models we recommend in each market sector and click through to our full, in-depth reviews to learn more.
These links are a great place to start in your journey to finding the best new or used car for your needs…
And remember, once you've found your perfect new or used car, Auto Express can help you buy it. Our Find a Car service delivers the top deals from our nationwide network of trusted dealers...
